

Homogenisation of temperature and precipitation
A homogenisation of the daily and monthly temperature (T) and precipitation (RR) data was completed for 17 selected stations (key stations). For temperatures on a daily basis, minimum (tmin) and maximum (tmax) values were used since this information is necessary for many climate indices such as frost days or summer days. For the monthly basis, mean temperature (tmean) is used. The homogenisation was done as non-climatic influences (e.g. station relocations) can influence the data series to appear as though trends or changes in climate parameters have occurred which do not exist in reality. To avoid this, different statistical methods have been developed to remove non-climatic influences as much as possible from the measurements. The possibility for negative influences increases as the time series become longer. Therefore, the criteria for those stations for which a homogenisation was done was that it should be representative for the area and have measurements reaching back into the past. Moreover there needed to exist highly correlated additional stations in the vicinity of the key station. Metadata about the stations was also desired. Metadata includes information on the station location, dates of station relocations, information on changes in the instrumentation or the observer, as well as the date of calibrations taking place. Table 1 gives the location of the stations and their beginning/ending dates as used in the homogenisation. The key stations are combinations of the time series of 2 stations if a relocation took place. If two dates are given, the first one is valid for temperature and the second one for precipitation.
|
Name |
Location |
Longitude [° E] |
Latitude [° N] |
Height [m] |
Start [YYYYMMDD] |
End [YYYYMMDD] |
|
Innsbruck Universität |
North Tyrol (Austria) |
11,3553 |
47,2589 |
579 |
18770101 |
19861231 |
|
11,3842 |
47,2600 |
578 |
19870101 |
20101231 |
||
|
St. Anton |
NorthTyrol (Austria) |
10,2703 |
47,1361 |
1298 |
19570101 |
20020331 |
|
10,2700 |
47,1317 |
1289 |
20020401 |
20101231 |
||
|
Kufstein |
NorthTyrol (Austria) |
12,1639 |
47,5742 |
492 |
19050101 |
20021231 |
|
12,1628 |
47,5753 |
490 |
20030101 |
20101231 |
||
|
Lienz |
East Tyrol (Austria) |
12,7867 |
46,8208 |
663 |
18800101 |
19851130 |
|
12,8083 |
46,8275 |
659 |
19851201 |
20101231 |
||
|
Reutte |
North Tyrol (Austria) |
10,7506 |
47,4947 |
870 |
19360101 |
19940630 |
|
10,7153 |
47,4944 |
842 |
19940401 |
20101231 |
||
|
Obergurgl |
North Tyrol (Austria) |
11,0272 |
46,8675 |
1938 |
19530101 |
19981231 |
|
11,0244 |
46,8667 |
1942 |
19990101 |
20101231 |
||
|
Bozen |
South Tyrol (Italy) |
11,3128 |
46,4977 |
254 |
19200401 |
20101231 |
|
Brixen |
South Tyrol (Italy) |
11,6679 |
46,7174 |
569 |
19830111 |
20101231 |
|
Sterzing |
South Tyrol (Italy) |
11,4294 |
46,8978 |
948 |
19200101 |
20101231 |
|
Marienberg |
South Tyrol (Italy) |
10,5213 |
46,7057 |
1310 |
19240101 |
20101231 |
|
St. Martin in Passeier |
South Tyrol (Italy) |
11,2279 |
46,7827 |
588 |
19200701 |
20101231 |
|
St. Magdalena in Gsies |
South Tyrol (Italy) |
12,2427 |
46,8353 |
1398 |
19200301 |
20101231 |
|
Sexten |
South Tyrol (Italy) |
12,3500 |
46,7030 |
1310 |
19200101 |
20101231 |
|
Agordo |
Veneto (Italy) |
12,0322 |
16,2767 |
578 |
19550101/ 19500101 |
19971231 |
|
12,0333 |
46,2775 |
585 |
19780101 |
20101231 |
||
|
Forno di Zoldo / Campo di Zoldo |
Veneto (Italy) |
12,1828 |
46,3497 |
848 |
19550101/ 19500101 |
20031231 |
|
12,1844 |
46,3461 |
884 |
20040101 |
20101231 |
||
|
Fortogna / Longarone |
Veneto (Italy) |
12,2933 |
46,2344 |
435 |
19550101/ 19500101 |
19991231 |
|
12,3039 |
46,2608 |
440 |
20000101 |
20121231 |
||
|
Asiago / Asiago Aeroporto |
Veneto (Italy) |
11,5267 |
45,8661 |
1046 |
19550101/ 19500101 |
20041231 |
|
11,5111 |
45,8828 |
1010 |
20050101 |
20101231 |
Table 1: Key stations and information on location and measurement times
Daily homogenisation
During a homogenisation process two steps are essential. First, the breaks (dates at which some changes concerning the station influencing the measurements took place) have to be identified, and, second, corrections have to be found that minimize the influence of those breaks. Both of these tasks are done using statistical methods including reference stations. The time series are adjusted to the latest measurements. This means that the time series after homogenisation represents the situation if the station would have been in the current surroundings using the current instrumentation for the entire duration of the time series.
For this dataset, daily homogenisation was done using the software HOMOP (Nemec et al., 2013) which combines PRODIGE (for break detection, Caussinus and Mestre, 2004), SPLIDHOM (for adjusting the time series of daily temperature, Mestre et al. 2011) and a modified INTERP-approach (for adjusting the time series of daily precipitation, Vincent et al. 2002).
For break detection, all stations within a radius of 200 m vertical and 100 km horizontal which have a correlation of at least 0.8 for temperature and 0.7 for precipitation are used. The method used is a log-likelihood approach. This means that mean differences (temperature) /quotients (precipitation) for reference periods and the whole time series are compared to each other. To avoid too many breaks a penalty-term is included. There are different possibilities to formulate this penalty term leading to different numbers of breaks. In order to improve the reliability of the break detection 3 different methods are used. Break detection is done for 5 different periods: the summer and winter season, summer and winter half years and the whole year.
A break is accepted as an actual break if it is detected in at least 2 of the 5 different periods of a year in at least 2 of the 3 penalty-criteria for at least half of the reference stations.
For precipitation, the quotients of monthly precipitations sums were used as the variability in daily precipitation is too high for reliable results (Auer et al. 2010). Moreover, not only the amount of precipitation was analysed for break points, but also the frequency of precipitation events with more than 5 mm daily precipitation.
For adjusting temperature time series, a spline function is calculated using the highest correlated reference station. The function depends on the temperature measured by the analysed station itself. Figure 1 provides an example where the adjustment (orange line) for one season for Agordo is given as a function of the measured value at this station.
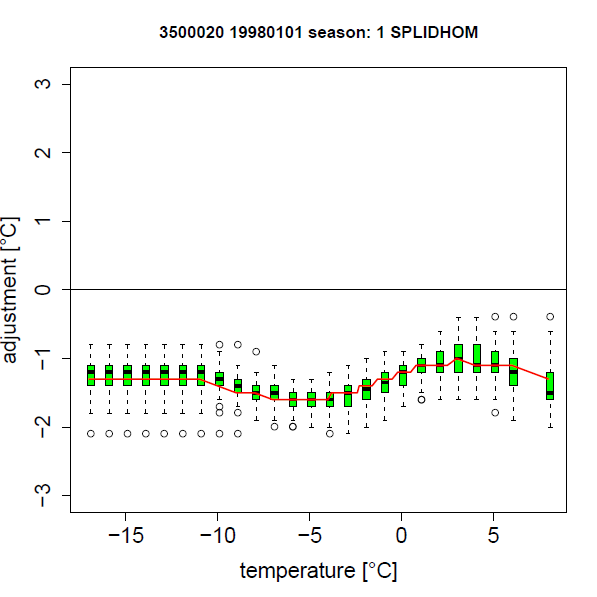
Figure 1: Temperature adjustment (orange line) for one season for Agordo given as a function of the measured value at this station. Green boxes indicate uncertainty of the adjustment.
For precipitation constant adjustments for each season were calculated. The adjustment is determined the the mean ratio between the key and the reference station after and before the break. Only the first break can be homogenised with this method. In the case that more than one break was detected in a precipitation series, only the latest one was homogenised.
After doing the adjustment, break detection is applied again to ensure successful homogenisation. A second quality criterion is the uncertainty of each adjustment given by the calculation of the adjustment with 3 different reference stations and a bootstrapping approach. If breaks still existed or the uncertainties were high, one of the following possibilities was applied:
- Change in the date of the break
- Change in the reference station used for adjustment (e.g. because of a similar break date in the reference station)
It must be kept in mind that homogenisation can only be done successfully if a sufficient number of reference stations are available. No statement can be made for periods without any reference stations. The last correction will be used until the very first measurement of the time series, but there is no guaranty that there is not an additional break in the period without reference stations. The final result of the homogenisation process for daily homogenisation can be seen in Table 2.
Monthly Homogenisation
Monthly homogenisation is done for all of the stations' monthly mean temperature. Precipitation is only monthly homogenised for those stations at which the homogenised daily data is not already homogeneous on monthly basis.
For monthly homogenisation the software HOMER (Mestre et al. 2013) was used, which was developed during the COST-Action ES0601 (Advances in homogenisation methods of climate series: an integrated approach HOME). It combines PRODIGE, ACMANT (Domonkos, 2011) and cghseg (Picard et al. 2011). For the correction part of the homogenisation process an ANOVA is used. While ACMANT is similar to PRODIGE, cghseg is a joint segmentation method which finds optimal segmentation for a network-wide optima by using an iterative procedure. The break detection is shown in figure 2, showing the comparison between Reutte and 5 reference stations. Thick black vertical lines indicate possible break locations. Only those possible breaks are treated as breaks for which more than half of the reference stations show a signal (matching breaks signals within a limited span of years).
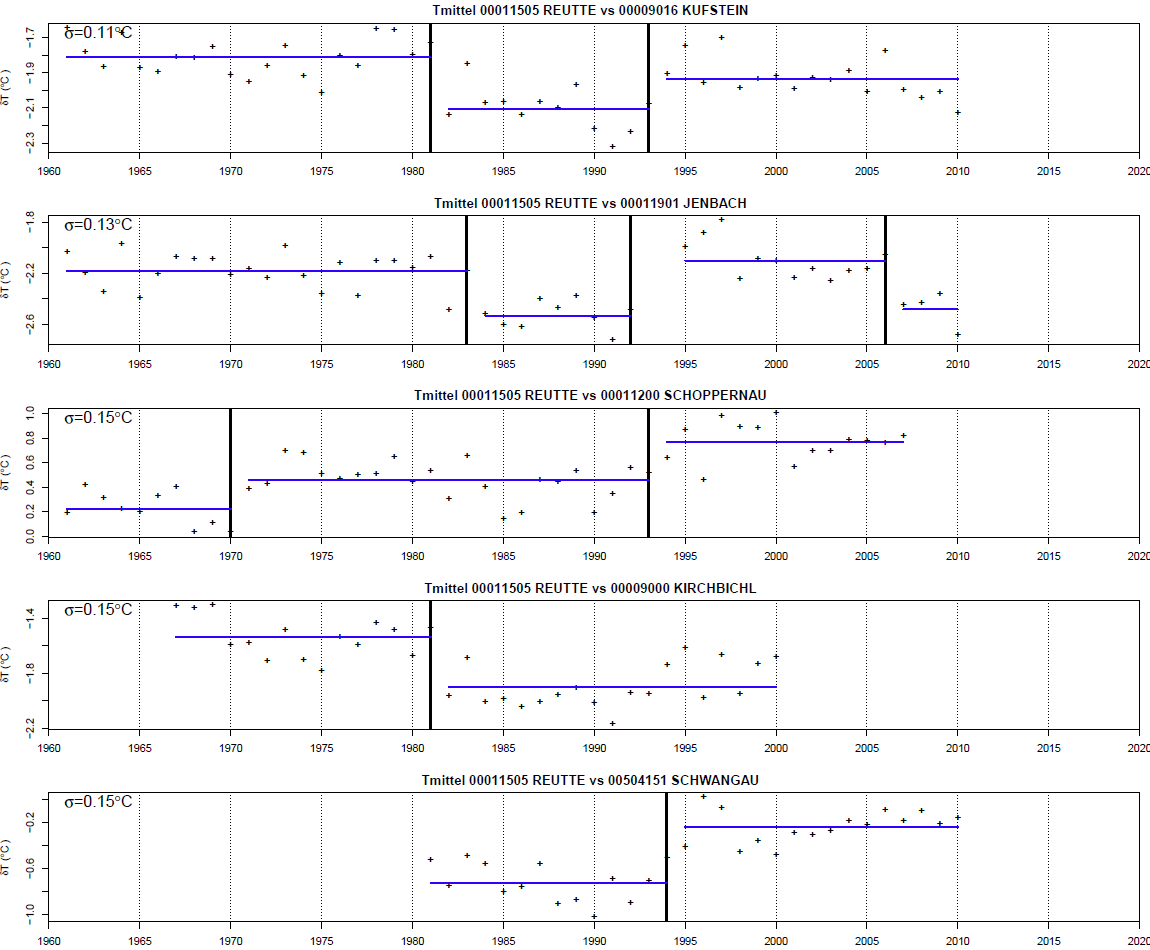
Figure 2: Break detection for temperature at Reutte and comparison to 5 reference stations. Thick black vertical lines indicate possible break locations.
Using this method a whole network of stations is homogenised. So not only the station of interest is homogenised, but also all of the used reference stations. For some of the stations homogenisation was not possible as not enough stations fulfilled the requirements for a reference station. Homogenised data for Bozen and Brixen are included in the HISTALP data set (Auer et al., 1999, Böhm et al., 2009) which consists of monthly homogenised temperature, pressure, precipitation, sunshine and cloudiness records, so HISTALP data for those stations were used instead of the original 3PClim-series. This solution was not possible for St. Martin in Passeier and St. Magdalena in Gsies.
To get some impression of the uncertainties of the homogenisations more than one network was done for each station if possible. The decision on the used homogenisation was based on the correlation of the stations, the location and the number of times the breaks have been found in the other networks.
For precipitation a homogeneity check was done for the monthly sum of homogenised daily precipitation series. In the case that no homogenisation has been possible for the daily time series, the original data was used. If this homogeneity check didn’t indicate any remaining break, no further homogenisation was done. The final results of daily and monthly homogenisation can be seen in Table 2.
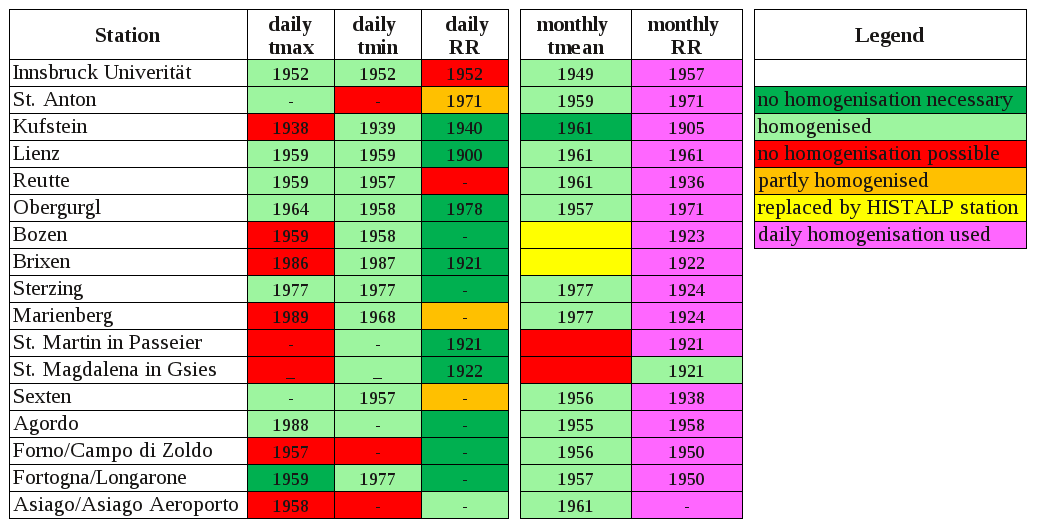
Table 2: Results of homogenisation. The year given in the columns shows the year before which only less than 3 reference stations are available. If a hyphen rather than a year is shown, at least 3 reference stations are available from the beginning of the measurement at the candidate station.
References:
Auer I., Böhm R., Schöner W., 1999: ALOCLIM – Austrian-Central European long-term climate. Creation of a multiple homogenised long-term climate dataset. In: Proceedings of the 2nd seminar for homogenisation of surface climatological data. Budapest, Nov.1998. WCDMP 41, WMO-TD 962: 47-71
Auer I., Nemec J., Gruber C., Chimani B., Türk K.,2010: HOM-START. Homogenisation of climate series on a daily basis, an application to the StartClim dataset. Vienna: Klima- und Energiefonds, project report, 34 pages
Böhm R., Auer I., Schöner W., Ganekind M., Gruber C., Jurkovic A., Orlik A., Ungersböck M., 2009: Eine neue Webseite mit instrumentellen Qualitäts-Klimadaten für den Grossraum Alpen zurück bis 1760. Wiener Mitteilungen Band 216: Hochwässer: Bemessung, Risikoanalyse und Vorhersage
Caussinus H., Mestre O., 2004: Detection and correction of artificial shifts in climate series. J.Roy. Stat. Soc. Series C53, 405-425
Domonkos P., 2011: Adapted Caussinus-Mestre Algorithm for Networks of Temperature series (ACMANT). Int J. Geosci, 2, 293-309
Mestre O., Gruber C., Prieur C., Caussinus H., and Jourdain S., 2011: SPLIDHOM: A method for homogenization of daily temperature observations,J. Appl. Meteorol. Climatol., 50, 2343–2358, doi:10.1175/2011JAMC2641.
Mestre O., Domonkos P., Picard F., Auer I., Robin S., Lebarbier E., Böhm R., Aguilar E., Guijarro J., Vertachnik G., Klancar M., Dubuisson B., Stepanek P., 2013: HOMER: a homogenization software – methods and applications, Idöjárás Quarterly Journal of Hungarian Meteorlogical Service, 47-67
Nemec J., Gruber C., Chimani B., Auer I., 2013: Trends in extreme temperature indices in Austria based on a new homogenised dataset of daily minimum and maximum temperature series. International Journal of Climatology 33/6, 1538–1550, doi:10.1002/joc.3532
Vincent LA., Zhang X., Bonsal BR., Hogg WD., 2002: Homogenization of Daily Temperatures over Canada, Journal of Climate, 15, 1322-1334
Picard F., Lebarbier E., Hoebeke M., Rigaill G., Thiam B., Robin S., 2011: Joint segmentation, calling and normalization of multiple CGH profiles, Biostatistics 12, 413-428